slides
Publish date: Apr 25, 2019Tags: minimal example
This is render from 009-slides
% Writing beautiful and reproducible slides quickly % Yihui Xie % 2012/04/30
Why
- after you finished typing
\documentclass{beamer}and\title{}, I have finished my first slide with markdown - far fewer commands to remember, e.g. to write bullet points, just begin with a dash “
-” instead of\begin{itemize}and\item; how things can be simpler? - I know you want math to show you are a statistician, e.g. $f(k)={n \choose k}p^{k}(1-p)^{n-k}$
- you do not need to maintain output – only maintain a source file
- HTML5/CSS3 is much more fun than LaTeX
A bit R code
head(cars)
##   speed dist
## 1     4    2
## 2     4   10
## 3     7    4
## 4     7   22
## 5     8   16
## 6     9   10
cor(cars)
##           speed      dist
## speed 1.0000000 0.8068949
## dist  0.8068949 1.0000000
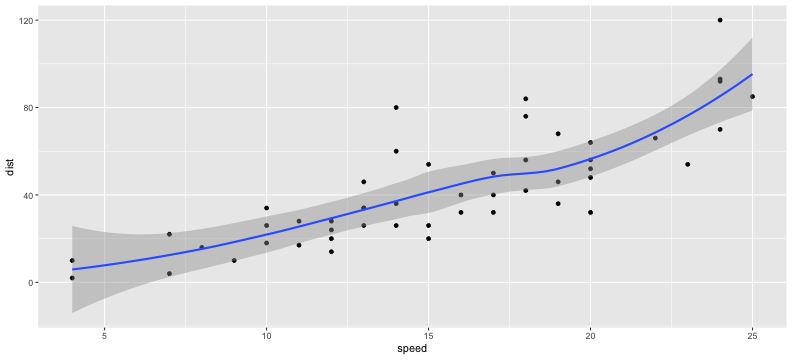
Graphics too
library(ggplot2)
qplot(speed, dist, data = cars) + geom_smooth()
How
- source editor: RStudio (perfect integration with knitr; one-click compilation); currently you have to use the version >= 0.96.109
- HTML5 slides converter: pandoc; this document was generated by:
pandoc -s -S -i -t dzslides --mathjax knitr-slides.md -o knitr-slides.html - the file
knitr-slides.mdis the markdown output from its source:library(knitr); knit('knitr-slides.Rmd') - or simple click the button
Knit HTMLin RStudio
For ninjas
- you should tweak the default style; why not try some Google web fonts? (think how painful it is to wrestle with fonts in LaTeX)
- pandoc provides 3 types of HTML5 slides (dzslides is one of them)
- you can tweak the default template to get better appearances
- if you have come up with a better dzslides template, please let me know or contribute to pandoc directly (e.g.
preblocks should havemax-widthandmax-height)
For beamer lovers
- pandoc supports conversion to beamer as well. period.
For Powerpoint lovers
- …
Reproducible research
It is good to include the session info, e.g. this document is produced with knitr. Here is my session info:
print(sessionInfo(), locale=FALSE)
## R version 3.5.3 (2019-03-11)
## Platform: x86_64-apple-darwin18.2.0 (64-bit)
## Running under: macOS Mojave 10.14.4
##
## Matrix products: default
## BLAS/LAPACK: /usr/local/Cellar/openblas/0.3.5/lib/libopenblasp-r0.3.5.dylib
##
## attached base packages:
## [1] stats     graphics  grDevices utils     datasets  methods   base
##
## other attached packages:
## [1] ggplot2_3.1.1 knitr_1.22
##
## loaded via a namespace (and not attached):
##  [1] Rcpp_1.0.1       magrittr_1.5     tidyselect_0.2.5 munsell_0.5.0
##  [5] colorspace_1.4-1 R6_2.4.0         rlang_0.3.4      highr_0.8
##  [9] stringr_1.4.0    plyr_1.8.4       dplyr_0.8.0.1    tools_3.5.3
## [13] grid_3.5.3       gtable_0.3.0     xfun_0.6         withr_2.1.2
## [17] lazyeval_0.2.2   digest_0.6.18    assertthat_0.2.1 tibble_2.1.1
## [21] crayon_1.3.4     purrr_0.3.2      codetools_0.2-16 glue_1.3.1
## [25] evaluate_0.13    labeling_0.3     stringi_1.4.3    compiler_3.5.3
## [29] pillar_1.3.1     scales_1.0.0     pkgconfig_2.0.2
Misc issues
- the plots are too wide? use the chunk option
out.widthwhich will be used in<img width=... />, e.g.out.width=400px
Life is short
so keep your audience awake!
