Xkcd Plot
Publish date: Apr 23, 2019Tags: r xkcd
Table of contents
Now let’s include the xkcd package. In particular I follow the xkcd-intro.
test fonts
Let’s first run the test as in the vignette:
library(extrafont)
## Registering fonts with R
library(ggplot2)
## Registered S3 methods overwritten by 'ggplot2':
##   method         from
##   [.quosures     rlang
##   c.quosures     rlang
##   print.quosures rlang
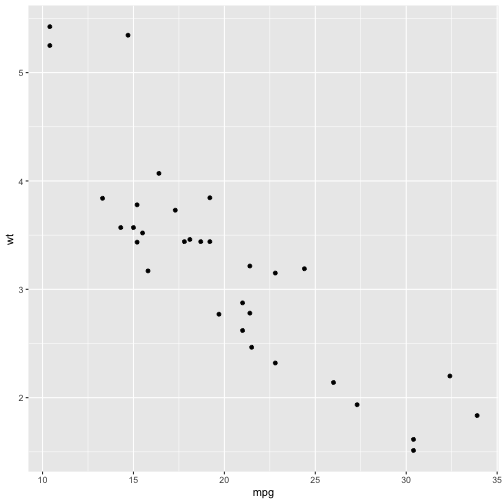
if ( "xkcd" %in% fonts()) {
 p <- ggplot() + geom_point(aes(x=mpg, y=wt), data=mtcars) +
   theme(text = element_text(size = 16, family = "xkcd"))
} else {
  warning("No xkcd fonts installed!")
  p <- ggplot() + geom_point(aes(x=mpg, y=wt), data=mtcars)
}
## Warning: No xkcd fonts installed!
p

The suggested way to install the xkcd fond did not work for me. Eventually I just downloaded the ttf file and used the system font manager to install it.
Load the library
library(xkcd)
## Error in library(xkcd): there is no package called 'xkcd'
Axis, Stick Figures and Facets
Now the famous cars plot.
xrange <- range(mtcars$mpg)
yrange <- range(mtcars$wt)
set.seed(123) # for reproducibility
p <- ggplot() + geom_point(aes(mpg, wt), data=mtcars) +  xkcdaxis(xrange,yrange)
## Error in xkcdaxis(xrange, yrange): could not find function "xkcdaxis"
p

xkcdman
ratioxy <- diff(xrange)/diff(yrange)
mapping <- aes(x, y, scale, ratioxy, angleofspine,
               anglerighthumerus, anglelefthumerus,
               anglerightradius, angleleftradius,
               anglerightleg, angleleftleg, angleofneck,
               linetype=city)
## Warning: Duplicated aesthetics after name standardisation:
dataman <- data.frame(x= c(15,30), y=c(3, 4),
                      scale = c(0.3,0.51) ,
                      ratioxy = ratioxy,
                      angleofspine =  -pi/2  ,
                      anglerighthumerus = c(pi/4, -pi/6),
                      anglelefthumerus = c(pi/2 + pi/4, pi + pi/6),
                      anglerightradius = c(pi/3, -pi/3),
                      angleleftradius = c(pi/3, -pi/3),
		      anglerightleg = 3*pi/2 -pi/12,
		      angleleftleg = 3*pi/2 + pi/12,
		      angleofneck = runif(1, 3*pi/2-pi/10, 3*pi/2+pi/10),
		      city = c("Liliput", "Brobdingnag")
)

p <- ggplot() + geom_point(aes(mpg, wt, colour=as.character(vs)), data=mtcars) +
  xkcdaxis(xrange,yrange) +
xkcdman(mapping, dataman)
## Error in xkcdaxis(xrange, yrange): could not find function "xkcdaxis"
p

Some Basic Examples
with text
volunteers <- data.frame(year=c(2007:2011),
                         number=c(56470, 56998, 59686, 61783, 64251))
xrange <- range(volunteers$year)
yrange <- range(volunteers$number)
ratioxy <-  diff(xrange) / diff(yrange)
datalines <- data.frame(xbegin=c(2008.3,2010.5),ybegin=c(63000,59600),
			xend=c(2008.5,2010.3), yend=c(63400,59000))
mapping <- aes(x, y, scale, ratioxy, angleofspine,
	       anglerighthumerus, anglelefthumerus,
	       anglerightradius, angleleftradius,
	       anglerightleg, angleleftleg, angleofneck)
dataman <- data.frame( x= c(2008,2010), y=c(63000, 58850),
		      scale = 1000 ,
		      ratioxy = ratioxy,
		      angleofspine =  -pi/2  ,
		      anglerighthumerus = c(-pi/6, -pi/6),
		      anglelefthumerus = c(-pi/2 - pi/6, -pi/2 - pi/6),
		      anglerightradius = c(pi/5, -pi/5),
		      angleleftradius = c(pi/5, -pi/5),
		      angleleftleg = 3*pi/2  + pi / 12 ,
		      anglerightleg = 3*pi/2  - pi / 12,
		      angleofneck = runif(1, 3*pi/2-pi/10, 3*pi/2+pi/10))

p <-
  ggplot() +
  geom_smooth(mapping=aes(x=year, y =number),
	      data = volunteers,
	      method = "loess") +
    xkcdaxis(xrange, yrange) +
    ylab("Volunteers at Caritas Spain") +
    xkcdman(mapping, dataman) +
    annotate("text", x=2008.7, y=63700,
	     label = "We Need\nVolunteers!", family="xkcd") +
    annotate("text", x=2010.6, y=60000,
	     label = "Sure\nI can!", family="xkcd") +
    xkcdline(aes(x=xbegin,
		 y=ybegin,
		 xend=xend, yend=yend),
	     datalines, xjitteramount = 0.12)
## Error in xkcdaxis(xrange, yrange): could not find function "xkcdaxis"
p
bar plot
data <- volunteers
data$xmin <- data$year - 0.1
data$xmax <- data$year + 0.1
data$ymin <- 50000
data$ymax <- data$number
xrange <- range(min(data$xmin)-0.1, max(data$xmax) + 0.1)
yrange <- range(min(data$ymin)+500, max(data$ymax) + 1000)
mapping <- aes(xmin=xmin,ymin=ymin,xmax=xmax,ymax=ymax)
p <- ggplot() + xkcdrect(mapping,data) +
  xkcdaxis(xrange,yrange) +
  xlab("Year") + ylab("Volunteers at Caritas Spain")
## Error in xkcdrect(mapping, data): could not find function "xkcdrect"
p # Figure 5.b

I also play around with float. One can also put css classes in the fig.cap string.
Currently the string is split at a # sign. The text after the sign is put as css class for the figure.