Creating Posts with Blogdown
I found some interesting note aboutblogdown being able to use page bundles in this post.My aim is a XKCD-alike blog for publishing r - knitr posts. I use hugo as generator. The papercss hugo theme which uses papercss provides a nice style sheet.
Todo use xkcd plot function in R.
The repo is on github.
blogdown being able to use page bundles in this post.The master branch contains also the github page published here.
You can make an empty start by cloning the plain branch:
git clone --single-branch --branch plain https://github.com/bdcaf/r-hugo-papercss-template.git
Many actions are run as make actions.
You can do to all actions doing
make setup
Create a post using
hugo new --kind r-bundle post/mytitle
For now this will create a skeleton directoru under content/post/mytitle/.
This content will contain a file index.md which will be overwritten.
The interesting file is source.md - it will get special treatment as it is ignored in the settings.
Without this ignoring it would show up twice.
It is a hugo specific that it will only fill out templates with extension .md.
I put in a modeline for vim to set the filetype to rnoweb.
the contents of docs/ is deleted before building the site.
If this is not done no longer used files will build up in there.
Should you need to keep files put them in the static directory.
I dislike the way hugo truncates posts automatically for summary.
Manually truncating by placing <!–more–> assures the head is rendered nicely. For short posts one can just put it at the and assure they are rendered fully.
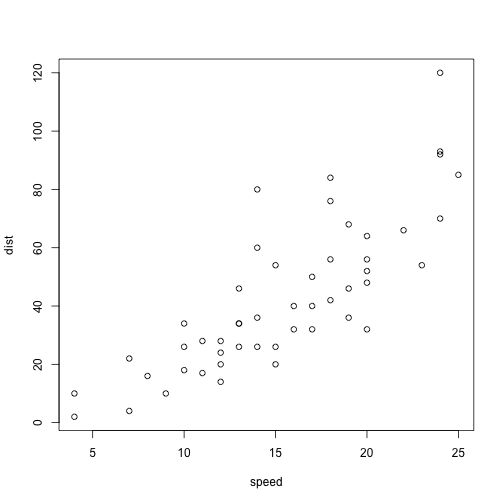
Let’s do a little R with the cars dataset.
summary(cars)
##      speed           dist
##  Min.   : 4.0   Min.   :  2.00
##  1st Qu.:12.0   1st Qu.: 26.00
##  Median :15.0   Median : 36.00
##  Mean   :15.4   Mean   : 42.98
##  3rd Qu.:19.0   3rd Qu.: 56.00
##  Max.   :25.0   Max.   :120.00
with(cars, plot(speed, dist))
The source is index.Rmd.
In knitr/R/hooks-md.R there is a custom function render_jekyll.
I wrote a similar one for hugo that makes figure shortcodes.
Then I could remove the perl from the makefile.
This was a dirty hack which I am happy to got rid of.
Suppose I will add some more shortcodes in the future.
For now see some examples here:
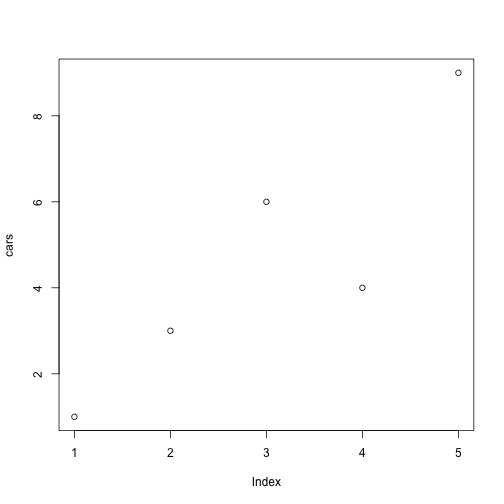
I use some examples from Producing Simple Graphs with R.
# Define the cars vector with 5 values
cars <- c(1, 3, 6, 4, 9)

# Graph the cars vector with all defaults
plot(cars)
Lorem ipsum dolor sit amet, consectetur adipisicing elit, sed do eiusmod tempor incididunt ut labore et dolore magna aliqua. Ut enim ad minim veniam, quis nostrud exercitation ullamco laboris nisi ut aliquip ex ea commodo consequat. Duis aute irure dolor in reprehenderit in voluptate velit esse cillum dolore eu fugiat nulla pariatur. Excepteur sint occaecat cupidatat non proident, sunt in culpa qui officia deserunt mollit anim id est laborum.
This is render from 007-text-output.Rmd
See if chunk options like tidy, prompt and echo, etc work as expected.
Although a blog post is not a R package the devtools package provides some useful tools. But who knows maybe a package will sprout from a post.
Provides some functions to create bundled data.
I like to use devtools::load_all() to load up all R functions from the R subdirectory.
I placed a simple function under R/hello_world.R